
|
Efficiency and Emission Reduction Methods |
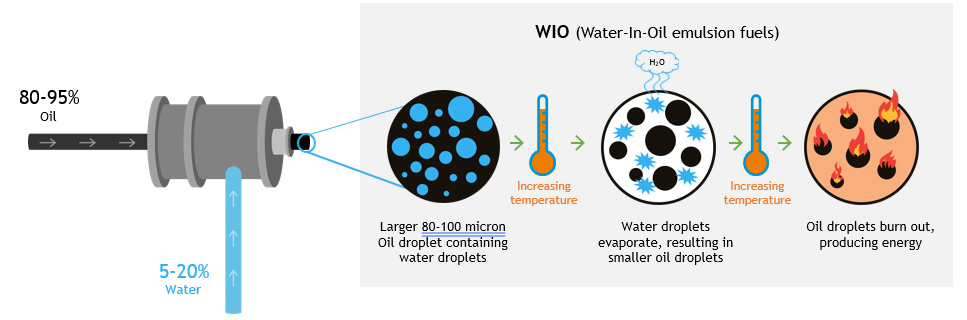
EFFICIENCY AND EMISSION REDUCTION METHODSThis section explores some of the technologies available to reduce fuel use and emissions. It includes assessment of the fuel and CO2 saving potential of various options. a. Water-in-Oil (WIO) Emulsion Fuel TechnologyConventional WIO (also called Water-in-Fuel or WIF) emulsion systems add typically 5-20% water to marine fuels, such as heavy fuel oil (HFO), maximum 0.50% sulphur fuel oil (VLSFO) or marine gasoil (MGO), to produce Water-in-Oil (WIO) emulsions. The WIO system is deployed on the vessel and integrated into the existing fuel system. The technology principle is summarized below:
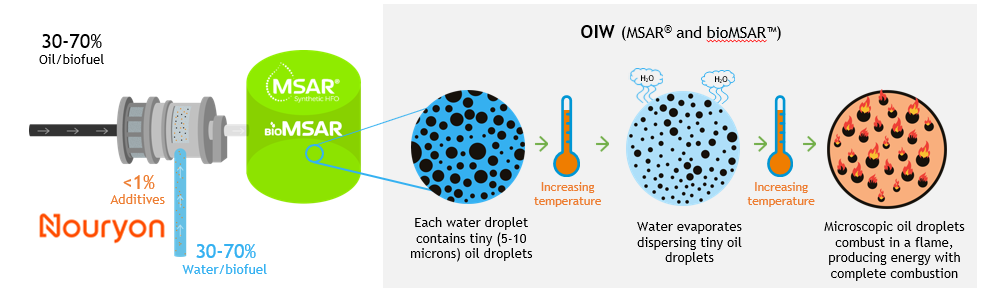
Source: Quadrise The main incentive to deploy WIO technology is to lower NOX emissions, which are typically reduced by 1% for every 1% of water that is added to the fuel, i.e. a 5-20% reduction. WIO also improves combustion (lower CO) and reduces Black Carbon due to secondary fuel atomization (the water droplets in the larger fuel droplet rapidly vaporize, creating an explosion effect). While WIO technology providers claim Specific Fuel Oil Consumption (SFOC) savings of 2-5%1 at lower rates of water addition (~10%), data from OEMs such as MAN2 have shown that as more water (>10%) is added to reduce NOx and CO further, the engine efficiency reduces and SFOC increases by 2-4%, negatively impacting CO2 emissions. CAPEX for the WIO unit is in the range of $0.1-0.2 million. Installation cost will depend on the available space on board, and may cost up to $0.2 million. The system is suitable for engines with both mechanical and electronic fuel injection. The WIO booster unit is modular and can be installed within a week while the vessel is in operation, with the only downtime needed to install the 4 new valves into the existing fuel lines (around 4 hours). b. Oil-in-Water (OIW) Emulsion Fuel TechnologyOil-in-Water emulsion (OIW) fuel technology suspends micron-sized (5-10µm) fuel droplets, using a high-speed colloid mill, in around 30% water using proprietary additives (including emulsifiers). As the oil droplets are suspended in the water, fuel viscosity is also dramatically reduced (unlike WIO).
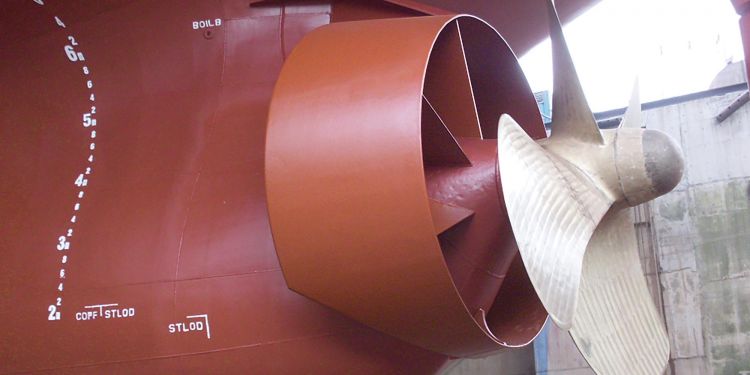
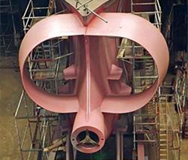
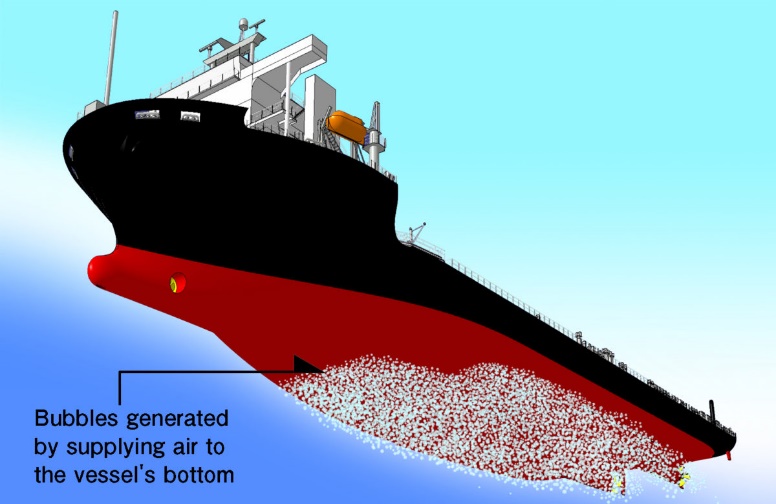
Source: Quadrise For high viscosity fuels (1000 – 1million cSt @50°C) the OIW system is installed on shore at a refinery or terminal, to provide a stable emulsion fuel that can be handled like HFO. With respect to the OIW system installed at the refinery or terminal, the fuel specification (inlet to OIW system, and outlet) has a much lower Al+Si specification (essentially the detection limit of the method IP501/470/ISO10478) to ensure that cat fines are not introduced to the fuel. In that way, OEMs have agreed that the centrifugal separators can be bypassed (to avoid the issues stated below) for OIW fuel service, and the standard filtration system can be used to protect the engine. For conventional marine fuels the system can also be deployed on the vessel, with the hydrocarbons passing through centrifuges as normal. As the colloid mill breaks up the fuel into very tiny droplets (<10 microns), there is complete carbon burnout, reducing Black Carbon and unburned hydrocarbons substantially. Diesel engine efficiency improves, which lowers fuel consumption and claims to achieve CO2 savings of up to 5-9% versus HSFO, with further cost savings available on VLSFO and biofuel blends (Source: Quadrise). The OIW system can also be used to improve blending of biofuels. The system is most suitable for engines with electronic fuel injection, as water content of over 25% is generally required to produce OIW fuels. The cost of additional equipment is in the range of $0.2-0.5 million. Installation cost will depend on the available space on board, and may cost $0.2-0.5 million. Work is carried out either by a competent shipyard (max 2 weeks stoppage), or an approved contractor as the fuel booster can be supplied in hatch-sized modules and an on-board fitting crew used over 1-2 weeks during sailing to avoid vessel stoppage. With the latter, downtime is needed to install new three-way valves into the existing fuel lines (under 8 hours). c. Propulsion Energy Saving Devices “ESDs” and designsPropulsion ESDs have the potential for fuel consumption and CO2 reductions of 2-5%. Energy saving ducts are stationary objects located upstream or downstream of the vessel’s propeller or rudder and are positioned in a way aiming to streamline, correct or regulate the flow around the area and therefore reduce the required thrust power of the vessel, effectively leading to fuel savings and associated CO2 emission reductions. The propeller and bulbous bow design characteristics and profile of some vessels have been optimised for higher services speeds. However, modification in this area to optimise for a potentially lower service speed (Eco speed) has seen high reduction in fuel consumption and associated emissions with a relatively short payback period. d. Hull Air LubricationHull Air Lubrication has the potential to reduce fuel consumption and CO2 emissions by 3-10%. A vessel forms a resistive force when moving through water, with friction between the hull and water being the most dominant. The concept of Air Lubrication is that compressed air is being injected between the hull of the moving ship and the water which can effectively reduce the frictional resistance and thus reduce the required power of the engine, and consequently fuel consumption and CO2 emissions. Pilot projects (retrofits) were completed a few years ago on LNG vessels. At the moment there are already dozens of orders for installation on newbuilds (mainly LNG carriers, and on a few tankers and bulk carriers).
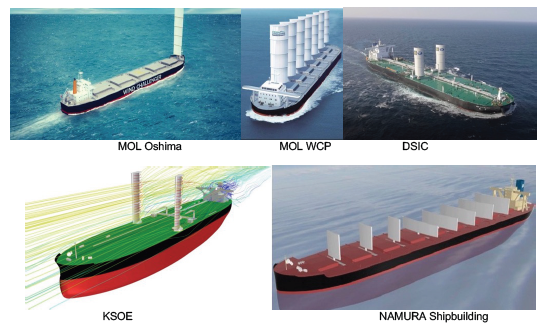
e. Low Friction Paints:Potential for fuel consumption savings and CO2 reductions of 3-7% are claimed, as long as hull fouling is low. Like Air Lubrication, discussed above, low friction antifouling paints aim to minimize the friction between the hull of the moving ship and the water, while concurrently preventing marine growth fouling and slime on the hull (which also cause increased friction). Low friction antifouling paints are higher in price (2-3 times) than self-polishing antifouling coating. Silicon-based paints are the priciest low friction antifouling paints. Paint makers claim these products give fuel savings and CO2 reductions between 3-7%. These types of antifouling paints are considered as a measure to improve energy efficiency. They used to be selected/applied mainly on high speed and special ship types (predominantly container ships, LNG carriers, fishing boats), but recently there is a trend for wider application (including tankers and bulk carriers). f. Wind assisted propulsion methods (sails, wings, rotors):Potential for fuel consumption savings and CO2 reductions of 10% or more are claimed, depending on favorable weather conditions. Wind assisted propulsion methods aim to reduce the load of your engines by assisting with wind power in the form of a stationary or moving sail, a rotating rotor or a wing-kite type. Sails and wings have previously been used on non-merchant vessels, and there have been trials of kites on merchant cargo ships. Rotors have been tested utilizing the Magnus Effect on merchant vessels with so far promising results, but very high CAPEX and very long payback periods both for newbuilds and retrofits.
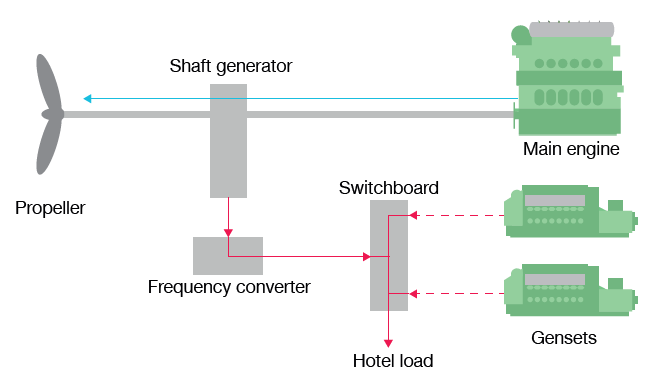
There are several makers of such rotors in the market already, however there are still only a few installations on commercial vessels. The makers claim that under certain weather conditions, these rotor devices may reduce fuel consumption by more than 10%. The equipment CAPEX cost may range between $2.5 to $6 million, depending on the ship size. Retrofit cost may exceed $1 million. Application on tankers and bulk carriers, either during newbuilding or retrofit stage, has been very limited to date. g. Shaft Generator (Power Take-Off/PTO, Power Take In/PTI):This technology offers potential for fuel consumption savings and CO2 reductions of 5-15%, depending on vessel size. Reserve propulsion power that is not required for sailing can instead be used for generating electricity via PTO/PTI equipment, widely known as Shaft Generators. Electric power will be produced by the main engine running (instead of an auxiliary Diesel Generator), hence reducing the need to generate electric power from auxiliary diesel generators. Fuel emission will be considerably reduced because a 2-stroke propulsion Main Engine is more fuel-efficient than a 4-stroke auxiliary Diesel Generator. This equipment can be either installed on a newbuild or on an existing vessel under certain conditions.
h. Improving energy efficiency through performance management, voyage optimization software, and other practical and commercial techniquesPotential for fuel consumption savings and associated CO2 reductions of up to 20% claimed (Source: DNV). There are several companies in the market offering software to improve ship energy efficiency in various ways. Several shipping companies cooperate in pilot projects or on a contract basis; testing and using innovative software for weather routing and voyage optimization using cutting-edge technology platforms. The feedback from the market indicates that there are benefits in optimizing speed and hull performance through AI and machine learning. These companies offer platforms with route/speed optimization, utilizing data from the daily noon reports of the vessel and live satellite weather data. Ship performance management plays a significant role in CO2 emission reductions; estimated at up to 20% (Source DNV). This is an obvious advantage. Technology to improve the way we manage vessels is already available, and it combines data collected from the ship’s existing systems/sensors and weather data (wind speed, direction, wave height, currents, etc) directly from satellites. Digitalization is the catalyst allowing for the management of all these inputs and a reduction of emissions. There are differences among the existing software solutions on offer. Each operator will assess and select the most appropriate software based on their requirements and needs, and this demands a good understanding of vessel operations. As for the cost, this is typically a yearly fee and may range from just a few thousand to many thousands of dollars per vessel. There are hundreds of on-going applications for all ship types and sizes. Apart from these software options, significant savings can be achieved using practical techniques such as ballast trim optimization (savings of over 10% validated by research in the 1980’s, especially on large tankers and large bulkers) and commercial techniques such as “just in time arrival” (which may need agreement between owners and voyage charterers on laden voyages). Summary:All of the above methods to reduce fuel consumption and emissions have already been applied and proven on large commercial deep-sea vessels, but the list is not exhaustive. As further technology develops, the list will grow. Selecting the right technology is a challenge and will depend on a number of factors. To make things more complicated: not all technologies are suitable for all types /size of vessels. Nevertheless, going forward all the alternative methods share the same goal and target: to assist in reducing CO2 emissions and thereby meeting IMO energy efficiency and carbon intensity targets, including the new Energy Efficiency Existing Ship Index (EEXI) and Carbon Intensity Indicator (CII) requirements. All the above options (with the exception of a-c) have a large reference of application on different ship types and sizes. They are technically mature and do not pose major safety concerns. Some of the technologies can also be combined to obtain aggregate improvements. It is clear that the % of emission reduction differs among these options. Each ship should be able to verify the total reduction following application of these options on a yearly basis via the mandatory IMO DCS (data collection system), that offers a transparent reporting process. The IMO DCS data are reviewed by a recognized organization (i.e. Classification Society). The emission reduction targets for shipping are extremely ambitious, and will require new technologies, new type of fuels, new regulatory frameworks, adequate finance and a completely new way of managing vessels. It is premature to comment on whether these targets are realistic or not, time will tell. It important to say that it is not up to shipping companies alone to strive to achieve decarbonisation of the sector, it is a global target, requiring involvement, support, and assistance from all stakeholders. 2 MAN Diesel & Turbo, Tier III Compliance, Low Speed Engines, Table 2. http://blueoceansoln.com/wp-content/uploads/2015/12/Microsoft-PowerPoint-UNECE-CLRTAP-RT-270208-doc11-MAN-presentation.pdf (p14) |

|
|